Project Home > Web Pages Home >
The
Squeeze:
As
mentioned previously, the Savonius wind turbine's blade is squeezed in shape
as it is twisted without any supports between the twist points. This phenomenon can be analyzed by observing the squeeze in Geometry Expressions in both the top and side view then modeling the squeeze in the computer algebra system Maple.
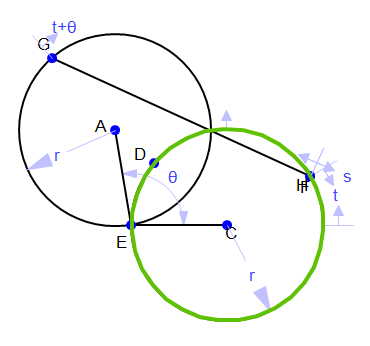
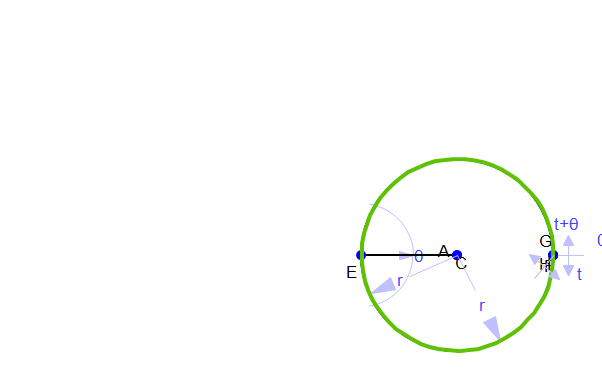
In Gemonetry Expressions, The angle between the circles in the top view is constrained as theta and
there are proportional points at t and theta+t on the circles with a
line segment connecting them. By moving the value of s, a proportional
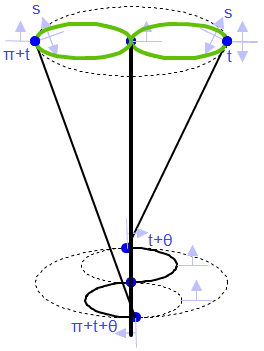
point on the line segment, the figure (left, below) moves up and down through all of the
turbine's horizontal cross sections. The locus of that point (in green) in terms of t is
always a circle but gets larger and smaller. The 3-dimensional view, right, below, shows the application of this same concept: moving up and down the turbine blade.
One important question that
comes out of this squeeze is at what point the squeeze is the most
extreme (or where is it most squeezed) in terms of s? It turns out
that this happens where the distance between the two intersection
points of the circle is equal to the diameter of the locus. This is
because this locus always goes through two points, the intersections
of the circles. How can this point be located, in terms of s, though?
It is important to keep in mind that the point s being in the same place as one circle
intersection doesn't mean the locus is at its minimum size. It is
best to eyeball where s is when the circle is at its minimum size and
then replace s with that estimate. This estimation can be confirmed by calculating the
locus' symbolic equation then drawing a circle and constraining it to
have the same equation as the locus. Then, calculating the circle's
radius and the distance between the circle intersections, and finding the radius to be half the distance means the correct value for
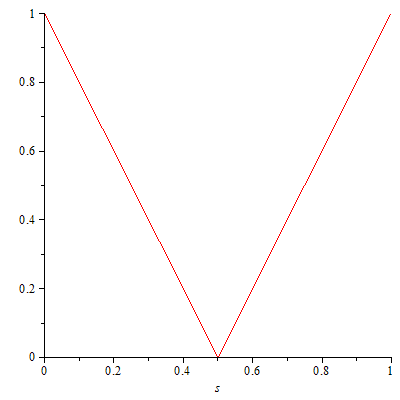
s has been found. Fortunately, the minimum radius is found at 0.5s, or halfway
between the top and the bottom. This means that the squeeze is
vertically symmetrical. Now the question is what effect theta (the twist)
has on the amount of squeeze. The figure below illustrates how the
angle of twist, with s constrained at the maximum squeeze value of 0.5, effects the
amount of squeeze. Remember, the smaller the locus, the more the
squeeze.
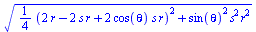
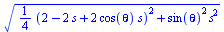
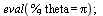
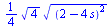
Next, this squeeze can be modeled with full accuracy in Maple.
First, Geometry Expressions' calculation for the symbolic radius of
the locus of the point constrained at s is copied as a Maple input and pasted into Maple. Then, the constant r
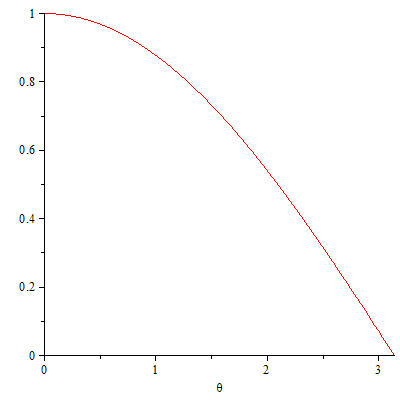
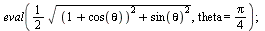
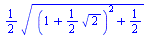
is set at 1 and theta is replaced with pi. Plotting the result gives the
amount of squeeze moving up/down the turbine when it is twisted pi
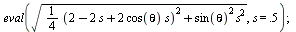
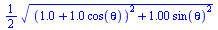
radians (note that Maple works almost exclusively in radians). Going back to the theta equation, a three-dimensional plot of the squeeze can also be created. In this plot, the
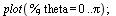
unmarked axis is the radius of the locus and the other two dimensions represent theta and s. Finally, there is a two-dimensional plot of
how the twist effects the radius at the minimum radius and a calculation of the radius at a specific theta value. The entire Maple worksheet is below.
Maple Worksheet:
| > |

 |
 |
(1) |
| > |
 |
 |
(2) |
| > |
 |
 |
(3) |
| > |
 |
| > |
 |
| > |
 |
 |
(4) |
| > |
 |
| > |
 |
 |
(5) |
Note: Maple's 3d Plot has been replaced with an animation of moving the plot to show its shape from different views.